See your AI teammate in action now
Ready to make support faster, kinder, easier and help customers feel good about choosing you?
PS: Sales improves too...
No credit card required
14 days free trial
DIY or Guided setup
Ready to make support faster, kinder, easier and help customers feel good about choosing you?
PS: Sales improves too...
No credit card required
14 days free trial
DIY or Guided setup
A guide to customer service performance indicators, covering 10 essential KPIs, how to calculate them, formulas, benchmarks, and linking support metrics to retention and revenue.
Manish Keswani

Summary by MagicalCX AI
Customer support becomes revenue-positive when you run a balanced KPI scorecard that targets concrete benchmarks like 80%+ CSAT and a 15–25% lift in First Contact Resolution, because resolving issues in one touch while lowering customer effort is what drives retention and repeat purchases.
In today's competitive landscape, customer service isn't just about solving problems; it's about creating revenue-positive experiences that build loyalty and drive growth. But how do you measure what truly matters? Moving beyond vanity metrics requires a strategic approach to customer service performance indicators (KPIs). Effective measurement is the first step toward transforming your support function from a cost center into a powerful profit engine.
This definitive guide dives into the 10 most critical KPIs that separate high-growth companies from the rest. We will break down the what, why, and how for each metric, providing practical formulas, industry benchmarks, and actionable steps. You will learn not just the definition of metrics like First Contact Resolution (FCR) and Customer Effort Score (CES), but also how to calculate them accurately and what good performance looks like. We will also explore how to connect these indicators to broader business goals, like customer retention and revenue.
Whether you're in e-commerce, SaaS, or managing a high-volume contact center, these insights will help you leverage data to create empathetic, efficient, and impactful customer interactions. For teams looking to push their analytics even further, leveraging advanced analytics is a logical next step. To dive deeper into specific applications, you might explore resources on AI models for call center KPI benchmarking. This article provides the foundational knowledge you need to start making data-driven decisions that enhance customer satisfaction and drive your bottom line. Let's explore the essential metrics.
First Contact Resolution (FCR) is one of the most critical customer service performance indicators, measuring the percentage of customer inquiries resolved entirely within the first interaction. A high FCR means customers don't need to call back, send follow-up emails, or start new chat sessions, leading directly to higher satisfaction and lower operational costs. It's the gold standard for efficient and effective support.

This metric demonstrates your team's ability to provide complete, accurate answers and solve problems on the first try. Platforms like MagicalCX are designed to boost FCR by equipping agents with tools that provide immediate access to customer history and enable complex actions without needing to escalate the issue.
FCR is a powerful indicator because it reflects both customer satisfaction and operational efficiency. A high FCR score means happier customers who feel their time is valued and a more productive support team that can handle more unique inquiries instead of repeat contacts.
Boosting your FCR requires a strategic approach focused on agent empowerment and process optimization.
For a deeper dive into tactical improvements, you can explore strategies on how to improve first call resolution. By focusing on FCR, you not only enhance the customer experience but also create a more efficient and empowered support team.
Customer Satisfaction Score (CSAT) is a fundamental customer service performance indicator that measures how happy customers are with a specific interaction, product, or service. It's typically gathered through a simple post-interaction survey asking customers to rate their satisfaction on a scale, often 1-5. A high CSAT score indicates that your team is effectively meeting, and exceeding, customer expectations in the moments that matter most.
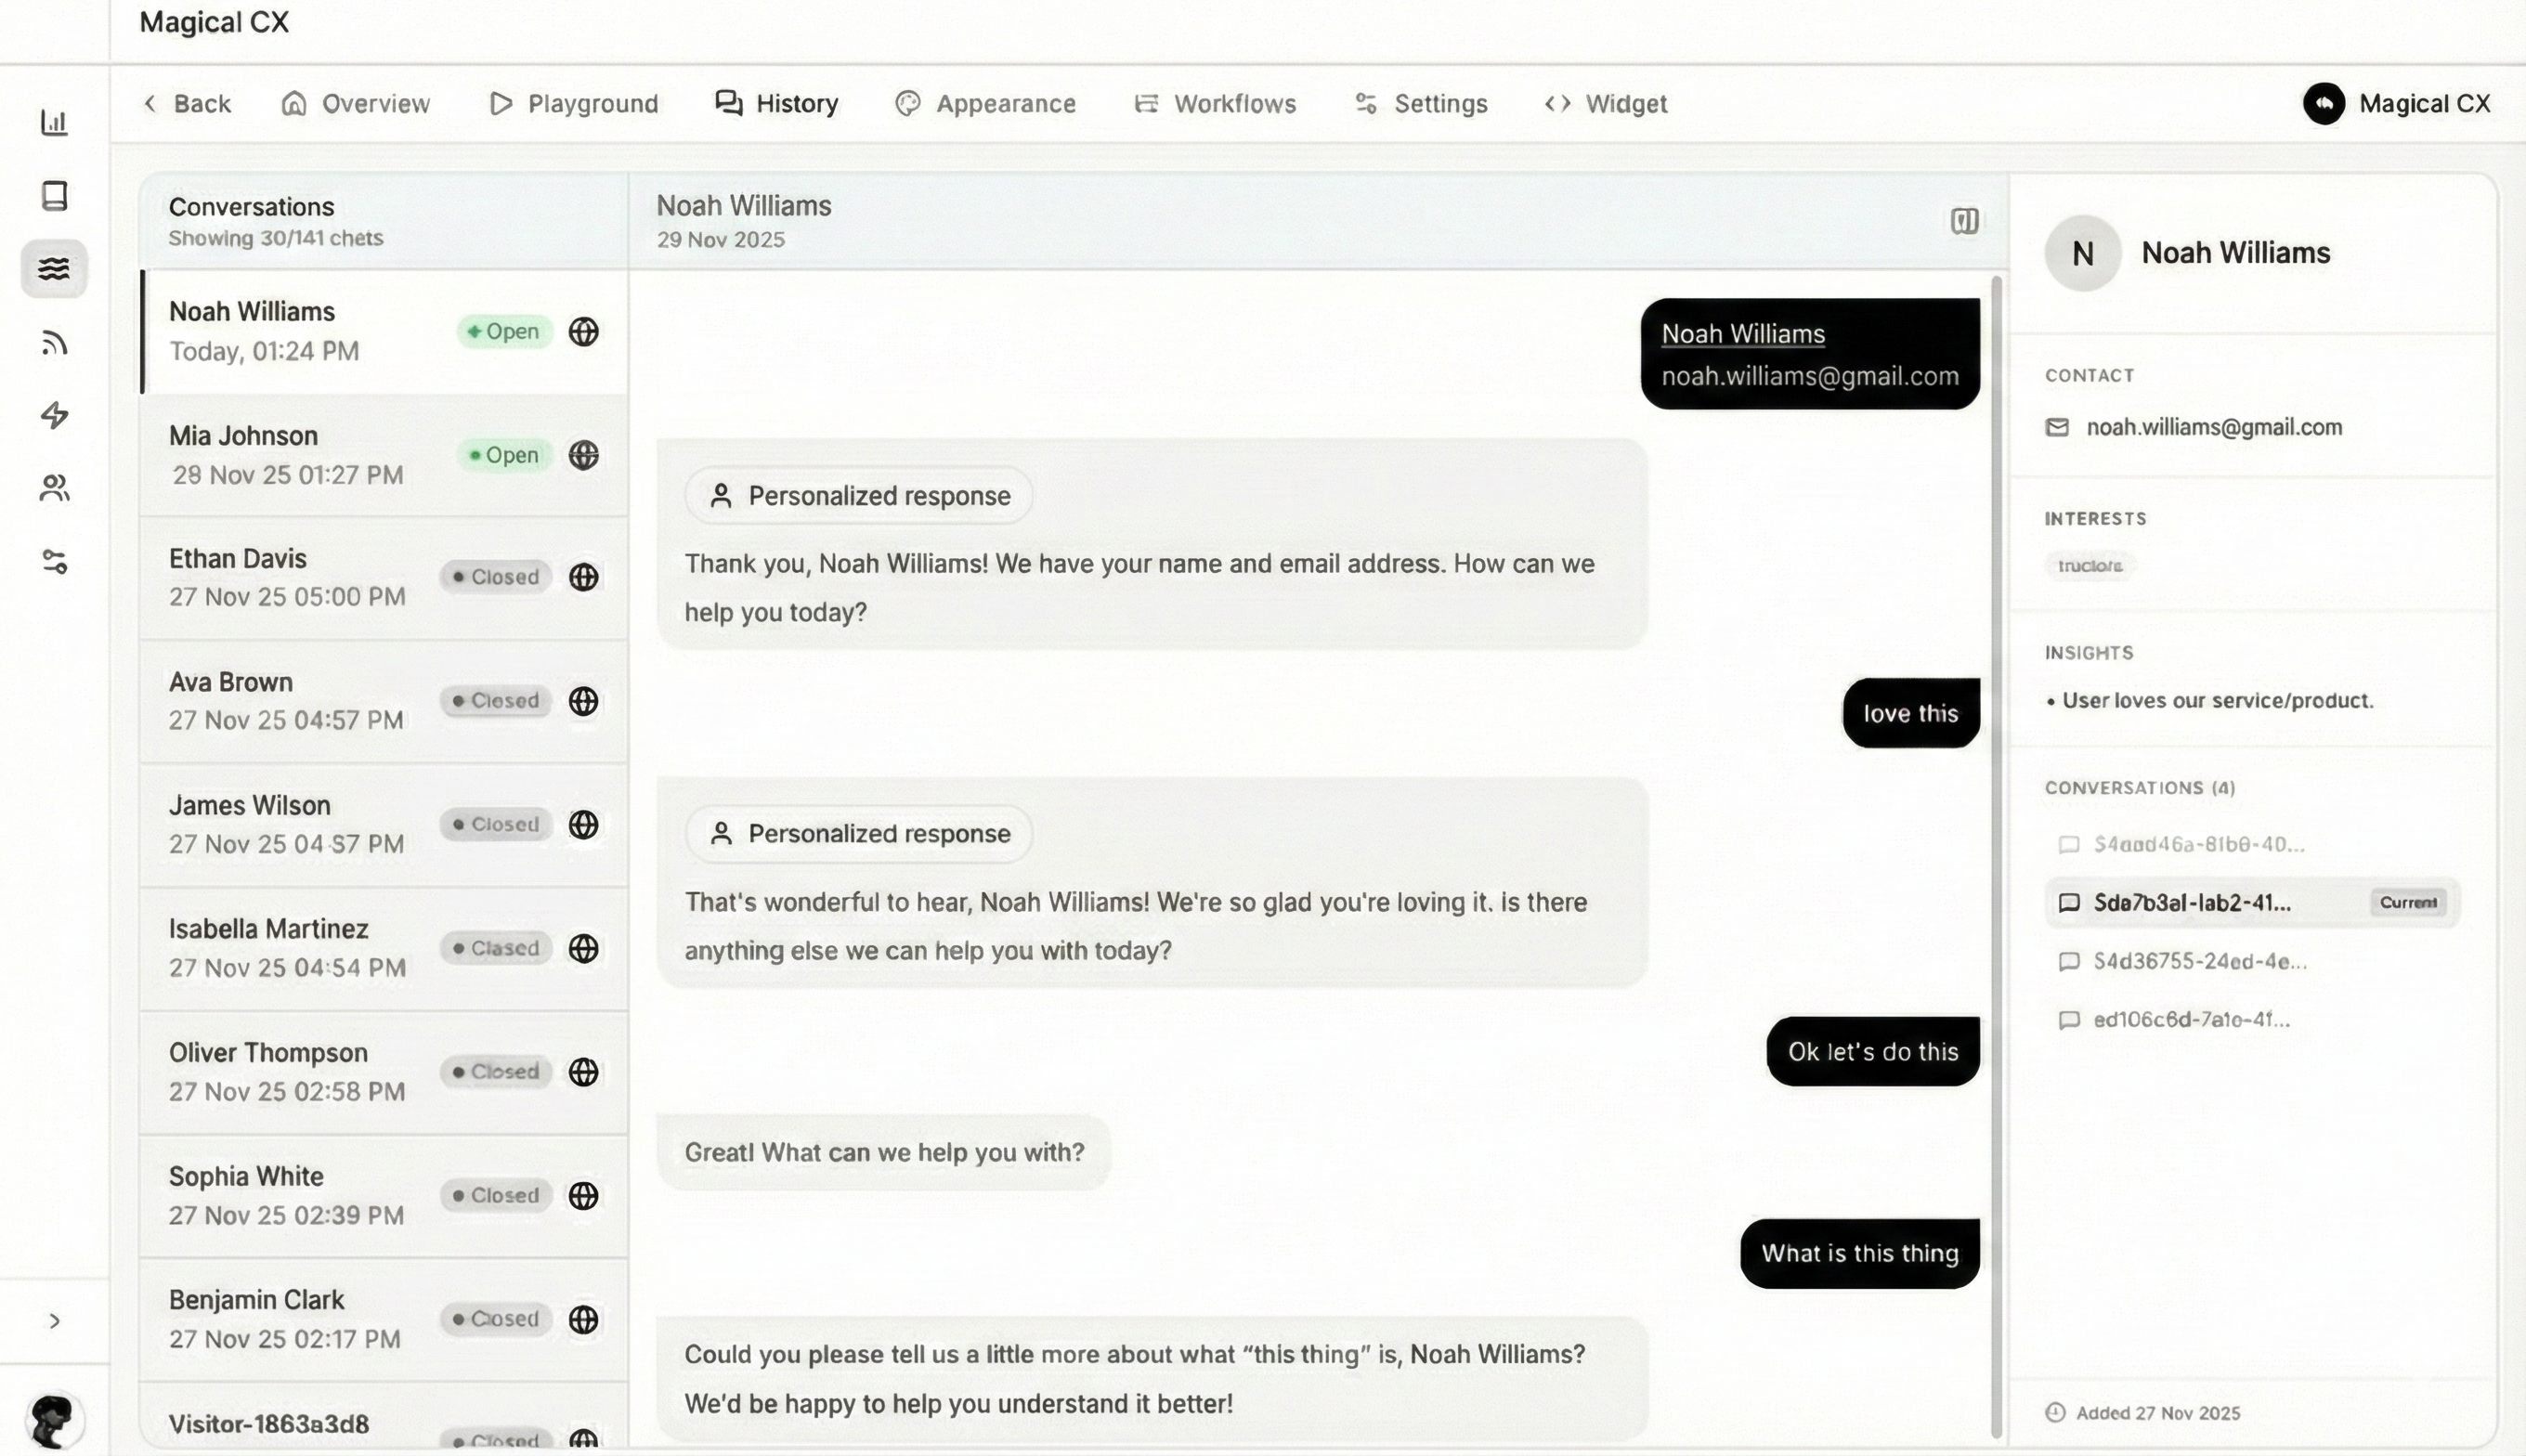
This metric provides a direct, immediate pulse on customer sentiment. For platforms like MagicalCX, CSAT is crucial for validating that AI-powered, empathy-first responses feel genuinely human and helpful. It ensures that efficiency gains don't come at the cost of the emotional connection promised by the platform, confirming that technology is enhancing the customer experience, not detracting from it.
CSAT is a powerful, real-time indicator of the quality of your customer interactions. It directly links support performance to customer happiness, helping you pinpoint both strengths and weaknesses in your service delivery. A consistently high CSAT score correlates with increased customer loyalty, repeat business, and positive word-of-mouth.
Boosting your CSAT score involves optimizing both the interaction quality and the feedback collection process itself.
A common industry benchmark is to aim for a CSAT score of 80% or higher. By focusing on this key customer service performance indicator, you ensure your team is consistently delivering experiences that build lasting customer relationships.
Net Promoter Score (NPS) is a widely adopted metric that measures customer loyalty and their willingness to recommend your brand. It’s calculated by asking customers a single question: "On a scale of 0-10, how likely are you to recommend our company/product/service to a friend or colleague?" This simple question provides a powerful snapshot of brand perception and customer sentiment.
Based on their responses, customers are categorized as Promoters (9-10), Passives (7-8), or Detractors (0-6). For platforms like MagicalCX, a high NPS is a direct reflection of how well an empathy-first, seamless customer experience translates into genuine brand advocacy, which is crucial for high-growth SaaS and D2C businesses.
NPS is a leading indicator of future business growth. Promoters are not just satisfied customers; they are brand evangelists who drive referrals and repeat business. Conversely, detractors can actively damage your reputation. Tracking NPS helps you understand your brand's standing and identify areas for improvement in the customer journey.
Improving your NPS means focusing on the entire customer experience, not just individual interactions. It's about building relationships that foster loyalty.
For a deeper dive into improving this key customer service performance indicator, explore actionable strategies on how to improve your Net Promoter Score. By systematically working to convert detractors and passives into promoters, you can build a loyal customer base that drives sustainable growth.
Average Response Time (ART) is a crucial customer service performance indicator that measures the average time it takes for your team to provide an initial response to a customer inquiry. A low ART is essential for meeting modern customer expectations for speed and accessibility, directly impacting initial satisfaction and brand perception. It reflects your team's agility and availability across all support channels.

This metric is particularly vital in an omnichannel environment where customers expect consistent, rapid service whether they use web chat, email, or social media. Platforms like MagicalCX are built to dramatically reduce ART by leveraging AI-powered automation to deliver instant answers for common issues, while intelligently routing more complex queries to the right human agent without delay.
ART is a direct measure of your service's accessibility and respect for the customer's time. A fast initial response acknowledges the customer's issue promptly, sets a positive tone for the entire interaction, and prevents frustration from building. It demonstrates that your brand is attentive and ready to help, which is a key driver of loyalty.
Lowering your ART involves a combination of smart automation, strategic resource allocation, and clear internal standards. The goal is to respond faster without sacrificing quality.
Customer Effort Score (CES) is a vital customer service performance indicator that measures how easy it was for a customer to get their issue resolved. Instead of asking about satisfaction, CES typically poses a question like, "To what extent do you agree or disagree with the following statement: The company made it easy for me to handle my issue?" on a scale, often 1-7. A low-effort experience is a strong predictor of customer loyalty.

This metric directly reflects the efficiency and user-friendliness of your support processes. Platforms like MagicalCX are built to minimize customer effort by using guided workflows and contextual AI to streamline complex journeys. The core idea is simple: the less work a customer has to do, the more likely they are to remain loyal.
CES is a powerful predictor of future customer behavior, especially retention and repeat purchases. A high-effort interaction can damage loyalty even if the issue is eventually resolved. Reducing friction in the support process is a direct investment in customer lifetime value.
Improving your CES involves systematically identifying and removing friction from key customer journeys.
Average Handle Time (AHT) is a core contact center metric that measures the average duration of a customer interaction from start to finish. This includes talk or chat time, hold time, and any after-call work (ACW) an agent performs to wrap up the case. It is a fundamental indicator of operational efficiency and agent productivity.
AHT is often viewed as a balancing act. While a lower AHT can signify efficiency, it must be managed carefully to avoid sacrificing service quality. Platforms like MagicalCX help strike this balance by using AI-powered automation to reduce the time spent on repetitive tasks, freeing agents to focus on high-quality, empathetic problem-solving for more complex issues.
AHT directly impacts staffing levels, operational costs, and the customer's time investment. A well-managed AHT means your team is resolving issues efficiently without rushing customers, leading to a streamlined, cost-effective operation. Tracking it is essential for resource planning and identifying process bottlenecks.
Improving AHT is about working smarter, not faster. The goal is to remove friction and administrative burdens from the agent's workflow.
Customer Retention Rate and Churn Rate are two sides of the same coin, acting as crucial customer service performance indicators that measure loyalty. Retention Rate is the percentage of customers who remain with your company over a period, while Churn Rate is the percentage who stop. These metrics are the ultimate measure of the value and experience you deliver, as great support directly prevents customers from leaving.
These KPIs reveal how well your support experience builds long-term relationships. Platforms like MagicalCX make retention a primary focus by enabling empathy-first support and seamless experiences. Reducing customer effort and resolving issues effectively are direct levers for minimizing churn and maximizing lifetime value, which is especially critical for subscription and D2C businesses.
Tracking retention and churn provides a clear, high-level view of your business's health and the quality of your customer relationships. A low churn rate is a direct reflection of a sticky product and excellent service, proving that your team is not just solving problems but also building loyalty that fuels sustainable growth.
Improving retention requires a proactive, data-driven approach that turns your support team into a loyalty-building engine.
For more strategies on building loyalty, you can learn how to create a successful client retention program. By focusing on these core metrics, you transform your support center from a cost center into a powerful engine for growth.
First Response Time (FRT) and Time to Resolution (TTR) are two of the most fundamental customer service performance indicators that measure speed and efficiency. FRT tracks the time between a customer's initial contact and the first agent response, while TTR measures the total time from that first contact until the issue is completely resolved. Fast responses show you’re listening, while quick resolutions prove you’re effective.
While FRT reflects your team's attentiveness, TTR demonstrates your ability to solve complex problems end-to-end. For businesses with multi-step issues, like in FinTech or B2B, a long TTR can severely damage customer trust and retention, making it a critical metric to monitor and optimize.
These metrics are essential because they directly impact customer perception of your brand's responsiveness and competence. A low FRT sets a positive tone for the entire interaction, while a low TTR reinforces that your team is capable of delivering solutions efficiently.
Improving these time-based metrics requires a combination of automation, smart routing, and process analysis.
Quality Score and Compliance Adherence are crucial customer service performance indicators that evaluate how well interactions align with internal standards and external regulations. Quality Score assesses factors like empathy, accuracy, and brand voice, while Compliance Adherence specifically tracks adherence to legal and company policies, such as data privacy disclosures or refund protocols.
These metrics ensure that every customer interaction, whether handled by an agent or AI, is not just efficient but also safe, accurate, and on-brand. For highly regulated industries like FinTech, platforms like MagicalCX are essential. They use a HumanlyClear conversation style and an EFRO Engine to maintain empathy and brand consistency while ensuring strict compliance.
These metrics are the foundation of trust and consistency in customer service. A high quality score shows your team is delivering the desired brand experience, while strong compliance adherence protects your business from legal risks and builds customer confidence. They are non-negotiable for maintaining brand integrity and operational excellence.
Improving these scores requires a systematic approach to monitoring, coaching, and process validation. It's about creating a culture of excellence and accountability.
Traditionally viewed as a cost center, modern customer service can be a powerful revenue driver. These customer service performance indicators, Conversion Rate and Revenue Per Interaction, shift the focus from cost-saving to value creation. They measure the financial impact of support, tracking outcomes like upsells, saved sales, plan upgrades, and successful retention efforts that occur during service conversations.
This approach quantifies the value of turning a potentially negative experience into a positive, revenue-generating one. Platforms like MagicalCX are built on this philosophy, using an "Experience, Fair-and-Relevant-Offer" (EFRO) Engine to identify moments where an offer is genuinely helpful and fair, transforming support into a profit center.
These metrics prove that exceptional service directly contributes to the bottom line. Tracking them helps justify investment in better tools and agent training, highlighting support's role in customer loyalty and lifetime value. It redefines a successful interaction as one that not only solves a problem but also strengthens the customer relationship and grows the business.
Boosting support-driven revenue requires a strategic, customer-centric approach, not an aggressive sales pitch.
| Metric | 🔄 Implementation complexity | 📊 Resource requirements | ⚡ Speed / Efficiency | ⭐ Expected outcomes | 💡 Ideal use cases |
|---|---|---|---|---|---|
| First Contact Resolution (FCR) | 🔄 Medium–High — CRM & KB integration, agent training | 📊 Moderate — guided workflows, analytics, omnichannel support | ⚡ High — reduces repeat contacts and handle time | ⭐ High — 15–25% FCR improvement; lower costs, higher CSAT | 💡 Returns, plan changes, onboarding, high-volume omnichannel issues |
| Customer Satisfaction Score (CSAT) | 🔄 Low — post-interaction survey setup | 📊 Low — survey tooling, dashboards, segmentation | ⚡ High — real-time feedback for quick changes | ⭐ Medium–High — clear sentiment signal but sample bias | 💡 Validate interaction quality; compare AI vs human experiences |
| Net Promoter Score (NPS) | 🔄 Low–Medium — periodic surveying and segmentation | 📊 Low–Medium — CRM linkage, follow-up analysis | ⚡ Low — long‑term indicator, slow-moving | ⭐ High — strong predictor of loyalty and revenue growth | 💡 Measure advocacy, cohort trends, product-market fit |
| Average Response Time (ART) | 🔄 Medium — cross-channel tracking & automation | 📊 Moderate — AI responses, routing, monitoring | ⚡ Very High — AI lowers first response latency dramatically | ⭐ High — improves perceived support quality and CSAT | 💡 Web/chat and messaging channels, high-volume real-time support |
| Customer Effort Score (CES) | 🔄 Medium — journey audits and targeted redesign | 📊 Moderate — guided workflows, UX/process changes | ⚡ Medium — process changes deliver durable gains | ⭐ Very High — strong correlation with retention and churn reduction | 💡 Complex journeys: returns, billing, plan changes, self‑service flows |
| Average Handle Time (AHT) | 🔄 Low–Medium — measurement easy; optimization needs coaching | 📊 Moderate — automation, training, after-call automation | ⚡ High for routine issues; variable for complex cases | ⭐ Medium — reduces cost but can risk quality if over‑optimized | 💡 Routine inquiry automation, capacity planning, agent coaching |
| Retention & Churn (Retention Rate & Churn Rate) | 🔄 High — cohort analysis, multi-source attribution | 📊 High — CRM, analytics, exit surveys, proactive workflows | ⚡ Low — slow to move but high long-term leverage | ⭐ Very High — strong impact on LTV; large ROI from small gains | 💡 Subscription & D2C businesses; high-value cohorts and at-risk segments |
| First Response Time (FRT) & Time to Resolution (TTR) | 🔄 Medium — track both metrics, handle async channels | 📊 Moderate — orchestration, escalation automation, monitoring | ⚡ FRT: Very High with AI; TTR: Variable by complexity | ⭐ High — reduces anxiety and abandonment; improves retention | 💡 Time-sensitive issues (B2B, FinTech), complex support workflows |
| Quality Score & Compliance Adherence | 🔄 High — detailed rubrics, regular audits, governance | 📊 High — auditors, sampling, training, compliance tooling | ⚡ Low — resource‑intensive to maintain high standards | ⭐ Very High — protects brand, legal risk, and trust | 💡 Regulated industries (FinTech, Financial Services), brand-critical roles |
| Conversion Rate & Revenue per Interaction | 🔄 Medium–High — attribution modeling and EFRO rules | 📊 High — CRM/transaction integration, tracking, agent enablement | ⚡ Medium — revenue shows with attribution lag | ⭐ High — can turn support into revenue-positive channel | 💡 D2C, subscription upsell/retention moments, high-LTV customer interactions |
Navigating the landscape of customer service performance indicators can feel like trying to read a map with a hundred different routes. We've explored ten critical signposts on this journey, from the operational precision of Average Handle Time (AHT) and First Contact Resolution (FCR) to the emotional resonance captured by Customer Satisfaction (CSAT) and Customer Effort Score (CES). Each metric, on its own, provides a valuable snapshot. FCR tells you if you’re solving problems effectively the first time, while CSAT reveals the immediate emotional aftermath of an interaction.
However, the real power isn't found in monitoring a single metric in isolation. True transformation occurs when you weave these individual data points into a cohesive narrative about your customer experience. A high FCR is fantastic, but if it comes at the cost of an abysmal CES, are you truly serving your customers well? Similarly, a stellar Net Promoter Score (NPS) means little if your customer churn rate is steadily climbing. The goal is to move beyond isolated numbers and build a holistic, balanced scorecard that tells the complete story of your service quality.
The journey from data collection to data-driven decision-making requires a strategic approach. It's not about tracking every metric possible; it's about choosing the right customer service performance indicators that align with your specific business goals.
Once you have your balanced scorecard, the next step is activation. Raw data in a spreadsheet is passive; visualized insights on a dynamic dashboard are active. This is where modern CX platforms become indispensable, turning complex data sets into actionable intelligence that empowers your team in real-time.
Key Takeaway: The ultimate goal is not just to measure performance but to create a virtuous cycle of improvement. When agents can see the direct impact of their work on key metrics, they become more engaged, proactive, and invested in delivering exceptional service.
To truly understand the 'why' behind the numbers, you need to analyze the unstructured data from customer conversations. Advanced tools can help you make sense of this qualitative feedback at scale. For instance, leveraging an AI Data Chat can uncover hidden trends, sentiment drivers, and emerging issues from thousands of support tickets, emails, and chat logs, providing deeper context to your quantitative KPI data. This combination of "what" and "why" is the foundation of a world-class customer service strategy.
Ultimately, mastering your customer service performance indicators is about more than hitting targets. It's about fostering a culture of continuous improvement, where every interaction is seen as an opportunity to strengthen a customer relationship. By selecting the right KPIs, setting realistic benchmarks, and empowering your team with the tools to act on those insights, you can stop just answering tickets and start building an unforgettable customer experience that becomes your most potent competitive advantage and a powerful driver of sustainable growth.
Ready to transform your customer service data into your biggest asset? MagicalCX provides a unified platform to instrument, visualize, and act on all the key performance indicators discussed in this guide. Stop juggling spreadsheets and start building a data-driven customer experience that drives loyalty and revenue by visiting MagicalCX to see how.