See your AI teammate in action now
Ready to make support faster, kinder, easier and help customers feel good about choosing you?
PS: Sales improves too...
No credit card required
14 days free trial
DIY or Guided setup
Ready to make support faster, kinder, easier and help customers feel good about choosing you?
PS: Sales improves too...
No credit card required
14 days free trial
DIY or Guided setup
A guide to call center efficiency metrics in 2026, covering FCR, AHT, ASA, agent occupancy, CSAT, NPS, cost per contact, reporting cadence, and AI automation impact.
Manish Keswani

Summary by MagicalCX AI
In 2026, the most reliable way to boost call center efficiency without tanking CSAT is to optimize for First Contact Resolution, since top teams hit 70%–75% FCR and only about 5% reach 80%+, while GenAI-assisted agents can raise issues resolved per hour by 14% and cut AHT by 9% when embedded into daily workflows.
Call center efficiency metrics are your best tool for understanding what’s really happening on the front lines. They’re the key performance indicators (KPIs) that show you how well your team is resolving customer issues, managing its time, and keeping an eye on the budget.
These numbers give you a vital snapshot of your operation's health, highlighting where you're excelling and where you might be falling short. By tracking them, you can move from guessing to knowing, making data-driven decisions that improve both agent performance and customer satisfaction.
Think of running a contact center like driving a car. You wouldn't get very far—or feel very confident—without a speedometer, a fuel gauge, or that little light that tells you the engine is overheating. Call center efficiency metrics are that dashboard. Without them, you're essentially driving blind, unable to tell how fast you're going, if you're about to run out of gas, or if there's a problem brewing under the hood.
For years, the game was all about speed—answer more calls, faster. But this created a "race to the bottom" where agents rushed interactions, leaving issues half-solved and customers deeply frustrated. True efficiency isn't just about being fast. It’s about finding a smart, sustainable balance between three core pillars:
Getting a handle on these metrics is the first real step in turning your call center from a necessary expense into a powerhouse for customer loyalty. For example, by tracking these metrics, a retail company might discover that while their agents answer calls quickly (good speed), many customers call back about the same order issue (poor quality), which doubles the cost for that interaction. Understanding this allows them to train agents on solving order issues completely the first time. If you want to go deeper, you can learn more about measuring customer service in our detailed guide.
Before we break down each metric, let's look at the big picture. Think of each KPI as a different gauge on your dashboard, giving you a unique piece of information about your team's performance.
The goal is not just to measure, but to understand. An isolated metric tells a story, but several metrics viewed together reveal the full picture of your customer experience.
The summary table below is a quick reference for the essential metrics we'll cover. It lays out what each one tracks and, more importantly, why it’s so critical for building a team that truly performs.
| Metric | What It Measures | Why It's Important |
|---|---|---|
| First Contact Resolution (FCR) | The percentage of inquiries resolved in a single interaction. | Indicates effectiveness and reduces repeat contacts, directly boosting customer satisfaction and lowering costs. |
| Average Handle Time (AHT) | The average duration of a customer interaction, from start to finish. | Helps with workforce planning and identifies inefficiencies, but must be balanced with quality. |
| Average Speed of Answer (ASA) | How quickly, on average, customer calls are answered by an agent. | A direct measure of customer wait time and accessibility of your support team. |
| Agent Occupancy Rate | The percentage of time agents spend on call-related activities. | Measures agent productivity and helps optimize staffing levels to avoid burnout or idle time. |
| Customer Satisfaction (CSAT) | Customer happiness with a specific interaction or service. | Connects operational efficiency directly to the customer's perceived quality of service. |
| Cost Per Contact | The total operational cost divided by the total number of contacts. | Provides a clear financial view of your support efficiency and helps justify investments in new technology. |
Looking at these together helps you connect the dots between how your team operates and how your customers feel—which is ultimately what matters most.
Before you can truly optimize your call center, you need to get a firm grip on the basics. Think of these four metrics as the bedrock of your entire operation. They give you the hard data you need to understand speed, quality, and how effectively your agents are spending their time. Once you nail these, everything else starts to fall into place.
It's all about a simple, powerful relationship: improving speed and quality naturally drives down costs. When you're fast and effective, you're not wasting money on repeat calls or inefficient workflows.

This balance creates a win-win scenario, keeping both your customers and your finance department happy.
If you have to pick one metric to obsess over, make it First Contact Resolution (FCR). It's the ultimate measure of effectiveness. FCR tells you what percentage of customer issues are completely solved in a single interaction—no follow-up calls, emails, or chats needed.
Formula: (Total Resolved Incidents on First Contact / Total Number of Incidents) x 100
A high FCR is a sign of a healthy, high-performing team. It means your customers are getting answers quickly and your agents aren’t getting stuck in a loop, solving the same problem over and over again. This one number has a massive ripple effect, boosting customer satisfaction and slashing operational costs. A practical example: a customer calls to update their shipping address. A high-FCR agent confirms the change, verifies the new address, and assures the customer it's applied to their active order, all in one call. A low-FCR interaction might involve the agent only changing the address in the profile but not on the active order, forcing a second call.
Looking ahead to 2026, the industry is shifting its focus squarely onto First Contact Resolution (FCR). Simply answering calls quickly is no longer enough; it's table stakes. While top-tier contact centers shoot for FCR rates of 70-75%, an elite 5% manage to hit a world-class 80% or higher. For growing e-commerce and D2C brands, getting FCR right through better training and smarter tools is the key to scaling support without breaking the bank.
Next up is Average Handle Time (AHT). This metric calculates the average length of a customer interaction, from start to finish. It includes everything: the actual conversation, any time the customer is on hold, and the post-call work an agent does to wrap things up.
AHT is a workhorse for forecasting and staffing, but it's also one of the most misunderstood metrics out there. The goal should never be to just crush AHT down to zero.
Here’s a practical example: A customer calls your e-commerce store about a tricky billing mistake. An agent focused only on a low AHT might get them off the phone in three minutes but fail to actually fix the underlying issue. The result? A low FCR and another call tomorrow. A better agent might take ten minutes, digging into the billing cycle, correcting the error, and clearly explaining what happened. That higher AHT is a sign of quality, not inefficiency, because that customer won't have to call back. True optimization comes from cutting out dead air on hold or automating wrap-up notes, not from rushing people off the phone. For a closer look, see our guide on how to improve average handling time the right way.
Average Speed of Answer (ASA) is exactly what it sounds like: how long does a customer have to wait, on average, before an agent picks up? This is all about your team's accessibility and that critical first impression.
Formula: Total Wait Time for Answered Calls / Total Number of Answered Calls
Nobody likes waiting. A low ASA is crucial because long hold times are a top driver of customer frustration and abandoned calls. The classic industry benchmark is answering 80% of calls within 20 seconds. These targets are often formalized in Service Level Agreements that set clear expectations for performance. For example, if your ASA creeps up to 60 seconds during peak hours, it’s an actionable insight that you may need to adjust staffing for that time block or optimize call routing to be more efficient.
But ASA doesn't tell the whole story. Answering a call in two seconds is useless if the agent can't solve the problem. That's why you should always look at ASA and FCR together to make sure you're delivering service that's both fast and effective.
Finally, there's Agent Occupancy Rate. This metric shows you what percentage of an agent's logged-in time is spent on active call-related work (talking, holding, and wrap-up) versus waiting for the next call to arrive.
Occupancy is your go-to metric for gauging agent productivity and fine-tuning your staffing levels. If your occupancy rate is too low—say, under 60%—it’s a strong signal that you might be overstaffed and your labor costs are higher than they need to be. An actionable insight here would be to cross-train agents to handle other channels, like email or chat, so they can switch tasks during call lulls.
On the flip side, an extremely high occupancy rate—anything over 90%—is a huge red flag for burnout. When agents have zero downtime between intense conversations, stress skyrockets, performance drops, and you risk losing your best people. Most call centers find the sweet spot is an occupancy rate between 75% and 85%, which keeps agents productive without pushing them to the breaking point.
It’s easy to get obsessed with speed in a call center. We look at metrics like Average Handle Time (AHT) and Agent Occupancy and think, "faster is better." And while those numbers are essential for keeping the operation running smoothly, they're only half the picture.
True success isn’t just about how fast you work; it’s about the result of that work. The real goal is a happy customer who feels heard and helped. That's why we have to balance our internal speed obsession with what the customer is actually experiencing. If we don’t, we risk building a super-efficient machine that leaves a trail of frustrated customers in its wake.
Imagine a manager gets laser-focused on one thing: driving down AHT. They start offering bonuses for the shortest calls, and pretty soon, the team is celebrating every second shaved off the average. On paper, the numbers look incredible. But what’s the view from the customer’s side?
A practical example: An agent, feeling the pressure to hit a three-minute AHT target, gives a customer a quick, flimsy answer to a complex software problem and quickly ends the call. The agent’s AHT looks great, but the customer’s issue is far from over. They’re forced to call back, now even more annoyed, completely tanking your First Contact Resolution (FCR).
This is the classic trap. When you push too hard on one efficiency metric, you almost always break another. An aggressive campaign to lower AHT often sends Customer Satisfaction (CSAT) scores into a nosedive and causes repeat calls to soar. This kicks off a vicious cycle where your agents are constantly busy but aren't actually solving problems, and your costs quietly creep up because you’re handling the same issue multiple times.
To sidestep this trap, you need to pair your operational metrics with outcome-focused ones. These tell you about the end result from the only perspective that really matters: the customer's. The three most important are Customer Satisfaction (CSAT), Net Promoter Score (NPS), and Cost per Contact.
A balanced scorecard is more than just a dashboard; it’s a way of thinking. It’s about reading the metrics together to understand the story they’re telling.
A truly balanced scorecard doesn’t just show you numbers; it tells you stories. It reveals how a dip in FCR directly impacts your Cost per Contact or how a focus on agent training leads to a surge in both CSAT and NPS.
Here’s a practical way to put that philosophy into practice:
By looking at your call center efficiency metrics through this balanced lens, you can move past simply chasing speed and start building a sustainable, high-quality experience that actually helps your business grow.
Knowing your call center's efficiency numbers is one thing. Actually improving them is a whole different ballgame. This is where modern technology comes in—not to replace your skilled agents, but to act as a powerful sidekick. AI and automation are fundamentally changing the old-school contact center model, proving you can be both faster and more human.
Instead of just cracking the whip to make agents work quicker, smart AI tools get to the real root of what's slowing things down. They take the mind-numbing, repetitive tasks off your agents' plates, serve up information instantly, and act as a guide through tricky customer problems. This frees up your team to do what they do best: actually connect with and help people.

A high Average Handle Time (AHT) is usually a sign that agents are struggling. They're either digging for information buried in different systems or getting bogged down in manual after-call work. AI targets these friction points directly.
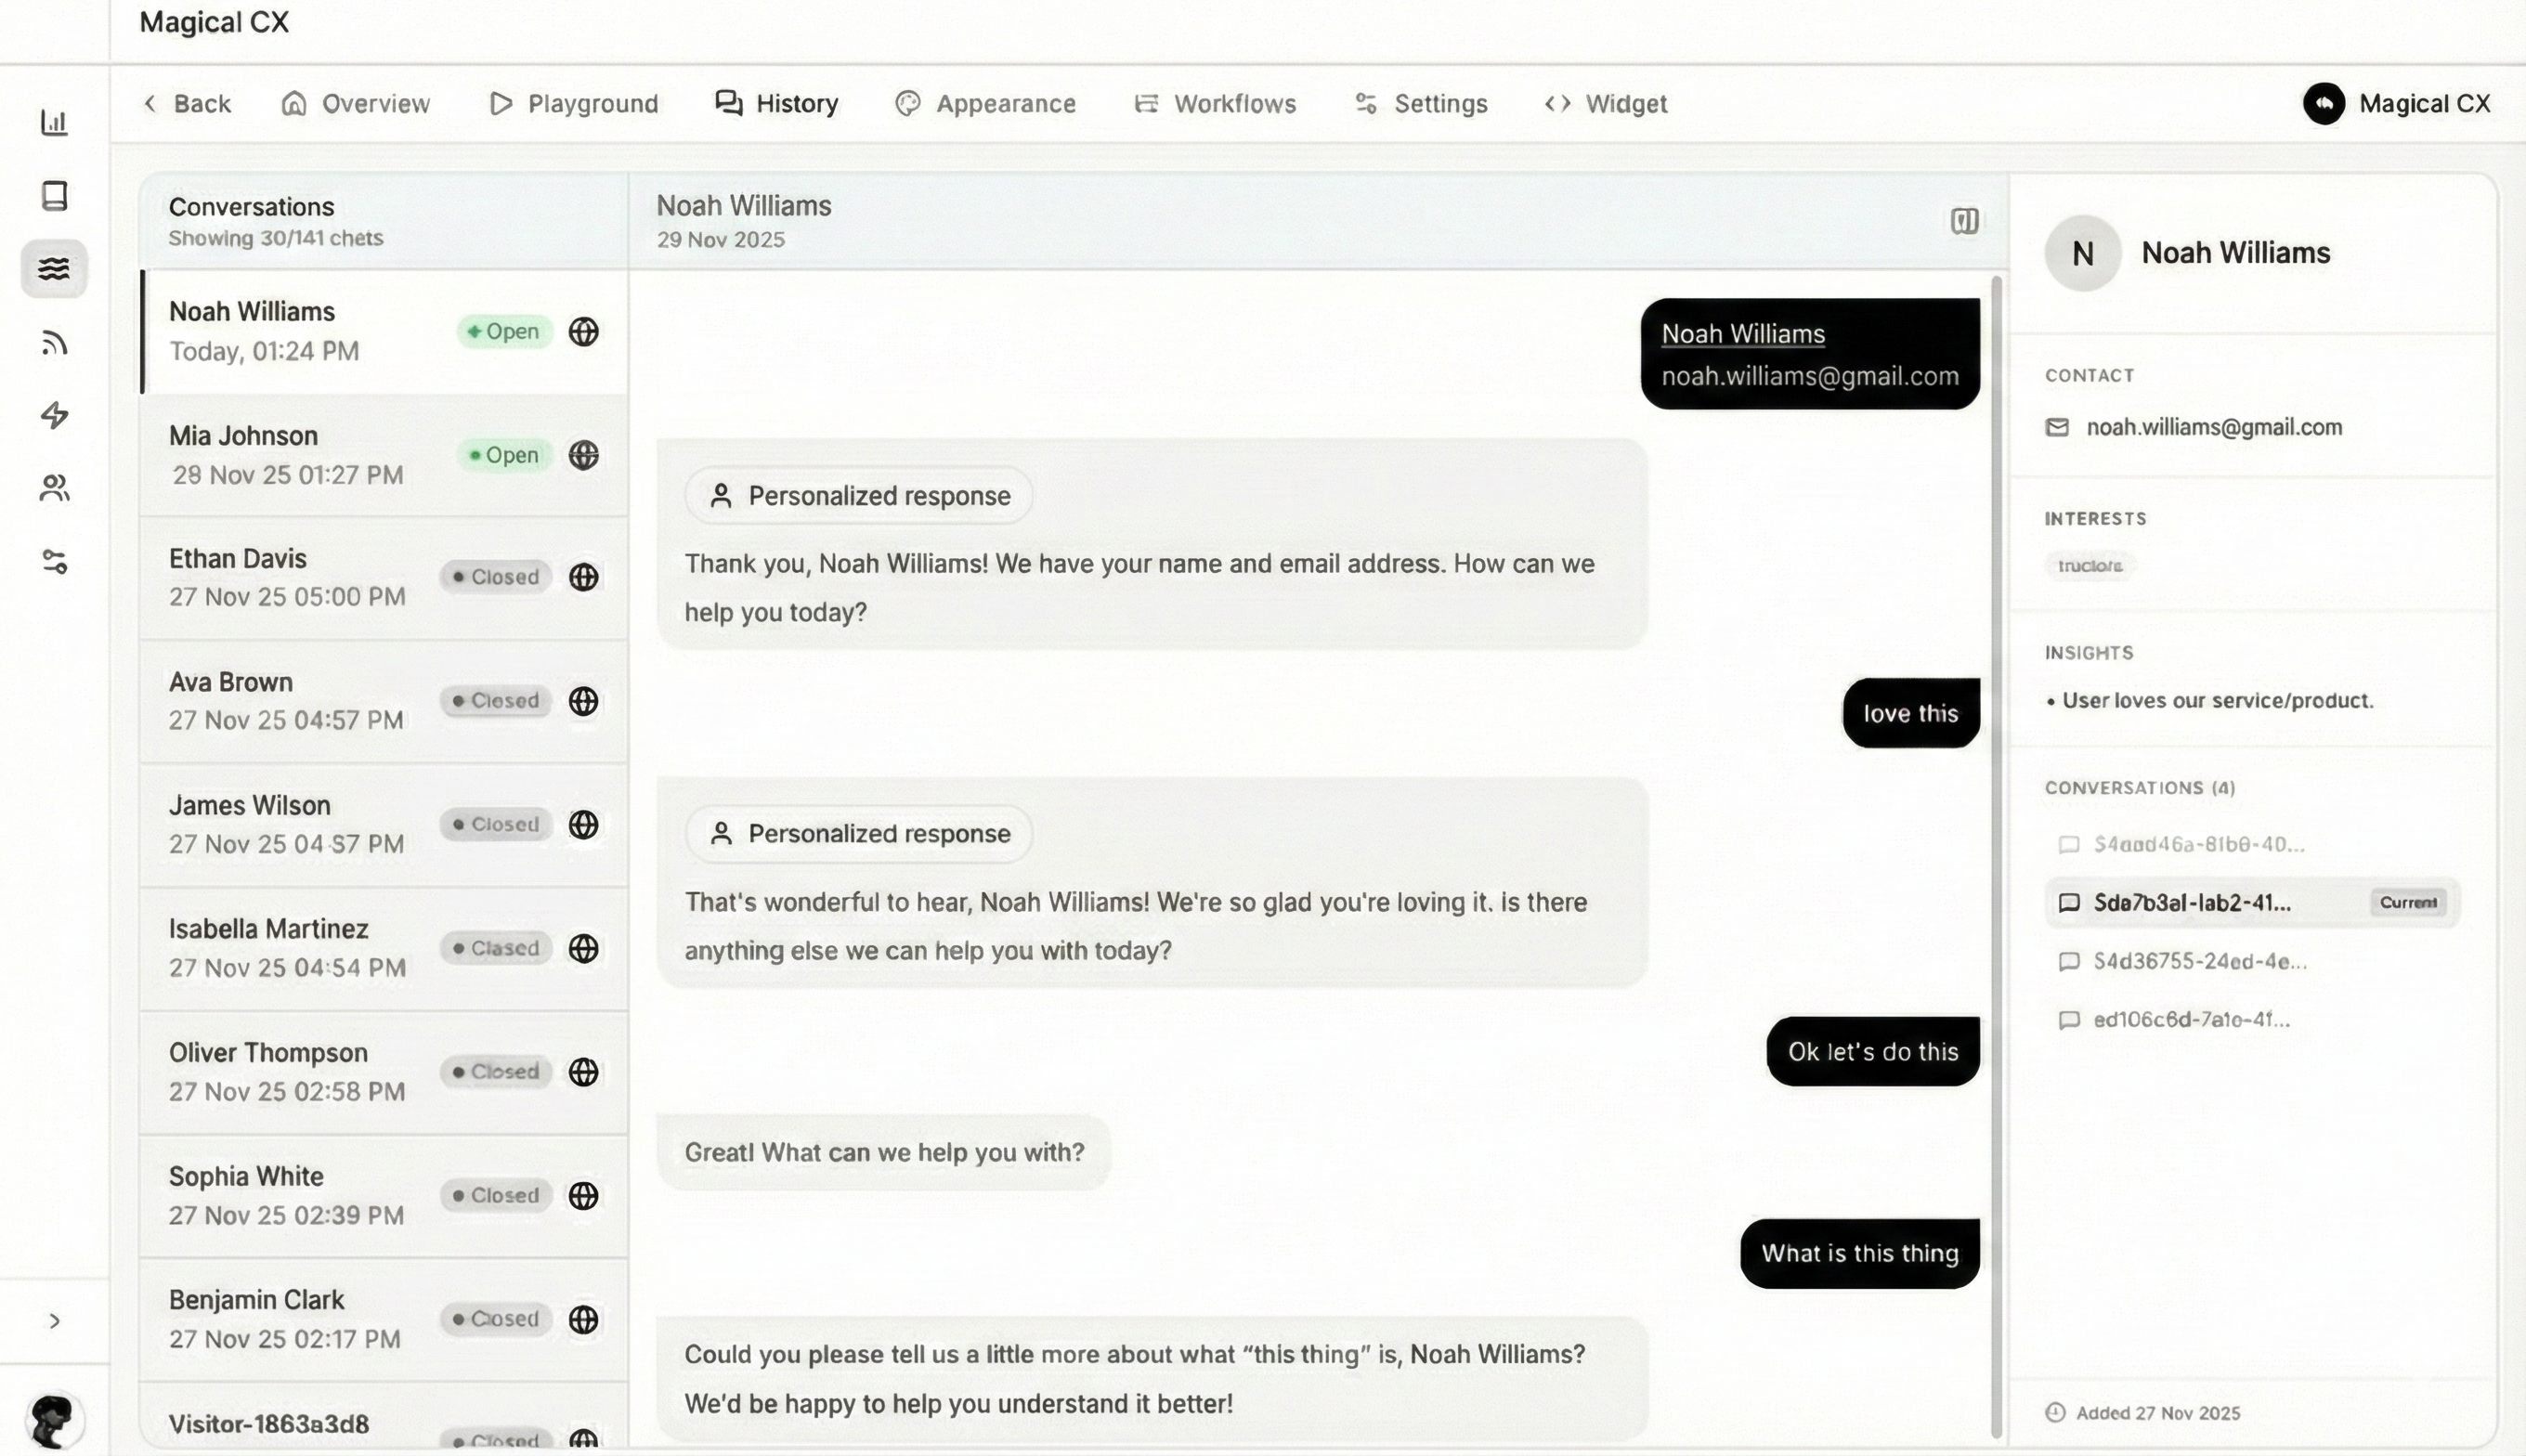
Consider this practical example: an agent handles a complex product return. The old way involved juggling multiple screens, manually searching for order numbers, and then spending five minutes typing up summary notes. With an AI-powered platform like MagicalCX, that whole frustrating process looks completely different.
This isn’t just about shaving seconds off AHT. When agents have the right information and processes at their fingertips, they solve problems correctly the first time, which sends your First Contact Resolution (FCR) rate through the roof.
Nothing sours a customer experience faster than long hold times and being bounced between departments. AI-driven intelligent routing is the antidote. It’s a much smarter way to get customers to the right person, right away. Behind the scenes, many of these tools rely on technologies like Automatic Speech Recognition (ASR) to understand exactly what a customer needs from their very first words.
By understanding a customer's intent from their initial words or chat message, AI can bypass clunky phone menus and route them directly to the agent best equipped to handle their specific issue. This precision drastically cuts down on Average Speed of Answer (ASA) and reduces frustrating internal transfers.
For example, a customer who types "I need to change my flight" can be instantly sent to an agent who specializes in booking changes, skipping the general queue entirely. This provides a seamless journey for the customer and a more efficient day for your team.
AI also transforms how we measure what’s truly happening on the floor. Traditional post-call surveys only give you a tiny, often biased, snapshot of customer sentiment. AI-powered sentiment analysis, on the other hand, can review 100% of interactions—calls, emails, and chats—to give you a complete picture of customer emotion.
This technology can flag a conversation in real-time if a customer is getting frustrated, letting a supervisor jump in to help before things go south. Over the long term, it uncovers trends—like a specific product feature that always causes confusion—giving you hard data to make meaningful improvements. The many advantages of AI in customer service are far-reaching and change how we think about quality.
The data backs this up. Organizations using GenAI-enabled agents have seen a 14% increase in issue resolution per hour and a 9% reduction in AHT. But simply buying the software isn't a magic bullet. While 88% of contact centers have deployed some form of AI, only a quarter have truly integrated it into their day-to-day work. The real win comes from thoughtfully weaving AI into your workflows to support your agents, not replace them. When you combine AI's power with human empathy, you can elevate your call center efficiency metrics and deliver a customer experience that truly stands out.
Having a pile of call center efficiency metrics is one thing; knowing what to do with them is another entirely. Raw data doesn't solve problems on its own. The real magic happens when you can look at those numbers and see a clear story—a story that shows you exactly where to focus your efforts to improve your team's performance and make customers happier.
This is about moving past the spreadsheet chaos and confidently using your data to steer the ship, fix the little snags that frustrate everyone, and build a truly great customer experience.

First things first: not all metrics deserve the same level of attention. Trying to react to every single fluctuation in every number is a surefire way to burn out your team and lose sight of what actually matters. A much smarter way to work is to set a reporting rhythm that matches the metric's purpose.
Think of your metrics like the gauges in a pilot's cockpit. Some you need to glance at constantly to manage the immediate flight path, while others you check periodically to make sure you're on the right long-term course. Your review schedule should work the same way.
Here’s a practical cadence for your key call center efficiency metrics:
Relying on overall averages can be incredibly deceptive. A "good" center-wide FCR of 75% might be masking a specific team that’s struggling with a dismal 40%. The most valuable insights almost always come from slicing your data into smaller, more specific groups.
By segmenting your data, you stop looking at the forest and start seeing the individual trees. This is where you uncover the why behind your numbers and find the most actionable opportunities for improvement.
Instead of just staring at a top-line number, start breaking it down. This is how you turn a vague, fuzzy problem into a set of very specific, solvable ones.
Actionable Segmentation Examples
The final step is to present all this great data in a way that actually inspires people to do something. A report that just lists numbers without context or a recommendation is just noise. A truly effective report tells a story and points toward a clear next step.
For instance, a weekly report shouldn't just say, "AHT went up by 30 seconds." A far more powerful report would say this:
"This week, AHT for 'Product X Installation' calls increased by 30 seconds, and CSAT for those same calls dropped by 5%. This pattern suggests our new installation guide is causing problems for customers. Actionable Insight: Let's pull some call transcripts for these interactions to find the exact point of confusion and update the agent knowledge base with a clearer walkthrough."
When you combine the right reporting schedule with deep data segmentation and clear, actionable recommendations, you turn your call center efficiency metrics from a static scoreboard into an intelligent, dynamic guide for your entire operation.
Once you start digging into call center metrics, you’ll inevitably run into a few common questions. Let's clear up some of the most frequent ones with practical answers so you can move forward with confidence.
If you ask ten different managers this question, you might get a few different answers. But if I had to put my money on one metric, it would be First Contact Resolution (FCR). Hands down.
Why? Because a high FCR proves you're actually solving problems, not just shuffling them around. It's the ultimate indicator of a healthy, effective support operation. When FCR goes up, repeat calls go down, which directly cuts your costs. More importantly, both customers and agents are happier because no one has to deal with the same frustrating issue twice.
Some metrics, like Average Handle Time (AHT), can be misleading on their own. But FCR gives you a balanced view of both speed and quality, making it an incredibly powerful benchmark for overall performance.
This is the classic balancing act, and the secret isn't to crack the whip and tell agents to hurry up. That's a surefire way to tank your CSAT scores. The real solution is to empower your team by removing the friction that slows them down in the first place.
True efficiency isn't about rushing the customer; it's about removing the obstacles that slow your agents down. This protects the quality of the conversation while still reducing handle time.
Here’s a practical, actionable approach for tackling both metrics at once:
Trying to watch every metric in real-time is a recipe for chaos. A much smarter approach is to match your reporting cadence to the metric's purpose. Think of it like driving a car: you glance at your speedometer constantly, but you only check the oil every few months.
Here’s a simple, practical schedule that works for most teams:
By tailoring your review frequency, you can stop drowning in data and start making focused, intelligent decisions.
Ready to turn your metrics into meaningful improvements? MagicalCX is an empathy-first AI platform designed to boost FCR, optimize AHT, and elevate your customer experience. Our conversational memory, guided workflows, and automated wrap-up give your agents the tools they need to be both efficient and effective. Transform your support operations with MagicalCX.